
Asset Allocation
Asset allocation is a strategy that will outperform the market on a risk adjusted basis over a long run of more than ten years, and luck is not a factor.
During the "Roaring Nineties" asset allocation as an investment strategy in the "pop" financial media went from being the "new, new thing" to something only feeble minded academicians did in their ivory towers if they weren't wired. After the tech debacle that began in 2000, diversified portfolios are once again in vogue.
I back-tested numerous asset allocation models since 1969 and I am convinced that it is EXTREMELY difficult to beat the risk adjusted return of a well designed asset allocation model. Two simple Asset Allocation Models that I designed have been tracked on websites that I have managed since June 30, 2001 and they are shown below.
What is Asset Allocation?
Simply stated, it is a value oriented system of diversified investing that encourages and counsels you to "Buy Low and Sell High". Easy to say - impossible for many to do.
What are Asset Classes?
Groups of assets, that on average, will move together. For example, when an economy is healthy and growing, then the stock market represented by that economic system will generally perform well and vice versa. You can create asset classes yourself e.g., real estate in your home town, or you can invest in broadly diversified markets e.g., global stock or bond markets.
What is meant by "a well designed Asset Allocation Model"?
A well designed Asset Allocation Model contains asset classes for which there is a reasonable expectation of satisfactory performance AND it contains asset classes that are not always expected to move in tandem i.e., when one zigs, the other should zag.
In which Asset Classes should I invest?
You should invest in asset classes within your personal "comfort zone". That means that if you are not comfortable with stocks, then you should NOT invest in stocks. It means that if you are xenophobic (and most folks are), then you should NOT invest in foreign stocks.
Why not?
Because when they crash (and they will) or when they underperform (and they will), you're gonna say, "I knew that was gonna happen." And then you're gonna sell them. And THAT, is exactly the wrong thing to do. So, in order to save yourself some time and money, determine your comfort zone and/or cure your phobias before you do anything else.
The Strategies
These are a long term strategies, meaning the longer the term, the better they will work.
What do I mean by long term?
The short answer is a minimum of ten years, because a ten year period will generally include a bear market and a bull market, but longer is better. In fact, a ten year period is probably the minimum period that should be examined in order to evaluate a strategy with a reasonable degree of confidence.
The Model Portfolios:
From 2001 through 2015
Four Model Portfolios were included on
this page
1. A 50% US Bonds and 50% US Stocks Portfolio
2. A timed US Bond and US Stock Portfolio
3. A 50% US Bonds and 50% GLOBAL Stocks Portfolio
4. A timed US Bond and GLOBAL Stock Portfolio
The bond and stock portions of both timed portfolios had a neutral allocation of 50% US Bonds and 50% stock however, their Bond-Stock allocations were changed as market conditions changed.
Both timed models were discontinued during January 2016.
The timed models added to the absolute return of the 50-50 models because they generally had a stock component greater than 50%, but they were also more volatile. My final evaluation of the timed strategy showed that the risk adjusted return difference wasn't great enough to continue the effort.
However, the primary reason the timed models were discontinued is that timed models imply an ability to predict an uptrend or a downtrend. Neither I nor anyone else has that ability. If anyone tells you otherwise, then you would do well to remember that John Kenneth Galbraith once said, "The only function of economic forecasting is to make astrologers look respectable".
Forecasters are especially bad at predicting downturns, and that's obviously when the investor could really use some help. The Economist analyzed the forecasts of the International Monetary Fund (IMF) from 1999 to 2014. Over that period there were 220 instances in which an economy grew in one year before shrinking in the next. In its April forecasts for the next year, the IMF never once predicted the contraction. Even in October of the year during which a recession began, the IMF predicted the recession had begun only half the time i.e., flip a coin.
1. The US Portfolio
This portfolio will be re-balanced on the final trading day of December.
50% Vanguard Intermediate Term Bond Index Fund (Ticker VBIIX)
50% Vanguard Total US Stock Market Index Fund (Ticker VTSMX)
The table below shows yearly return data for the components of the US Model and the return of the 50% Stock, 50% Bond US Portfolio. In my opinion, the risk adjusted return of this portfolio will be extremely difficult to beat over the long run if you restrict yourself to US assets.
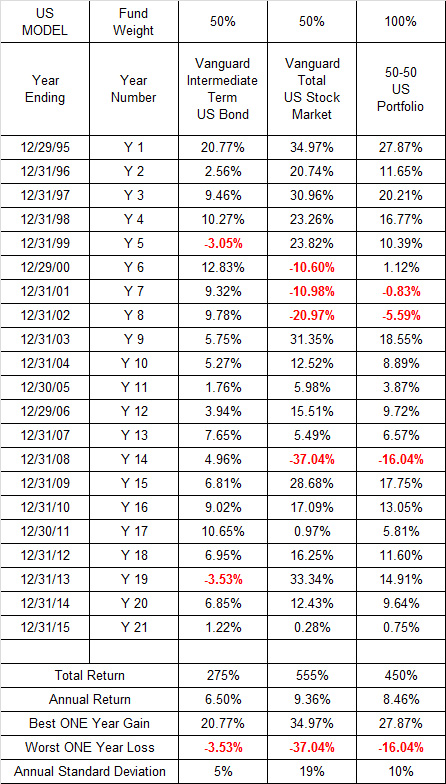
This stock component of this portfolio
had a considerably higher return than the bond component, but as
noted earlier, stocks add volatility i.e., the higher the standard
deviation,
the greater the volatility. If you can handle the volatility
emotionally and financially, then increase the stock portion of your
personal portfolio accordingly, but before you do, study the GLOBAL
Portfolio below, and study my comments.
Why does the US Portfolio above and the Global Portfolio below start after 1994?
The Vanguard Intermediate Term Bond Index Fund has a February 28, 1994 inception date and the Vanguard Emerging Market Index Fund has a May 4, 1994 inception date.
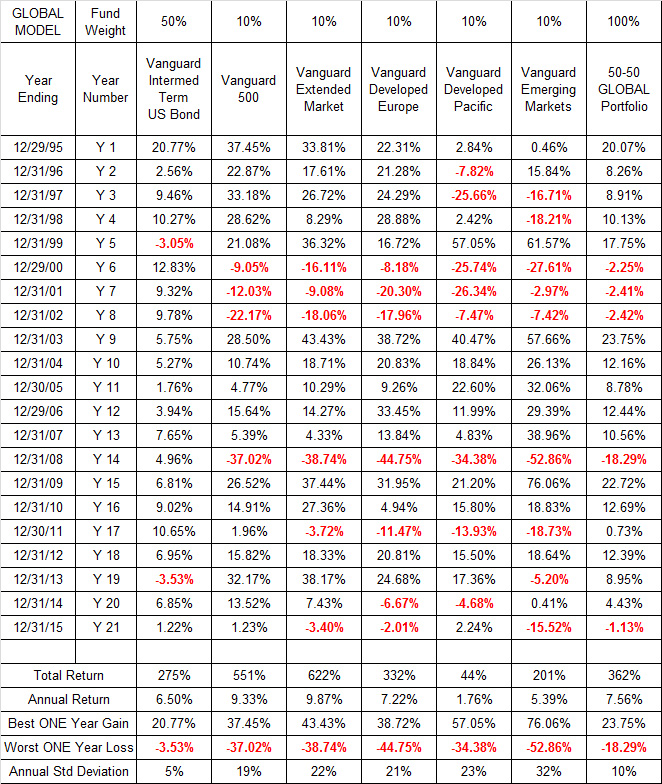
2. The Global Portfolio
This portfolio will be re-balanced on the final trading day of December.
50% Vanguard Intermediate Term Bond Index Fund (Ticker VBIIX)
10% Vanguard 500 Index Fund (Ticker VFINX)
10% Vanguard Extended Market Index Fund (Ticker VEXMX)
10% Vanguard European Index Fund (Ticker VEURX)
10% Vanguard Pacific Index Fund (Ticker VPACX)
10% Vanguard Emerging Market Index Fund (Ticker VEIEX)
The table below shows yearly return data for the components of the Global Model and the return of the 50% Stock, 50% Bond Global Portfolio. In my opinion, the risk adjusted return of this portfolio will be extremely difficult to beat over the long run.
The Table below shows yearly and cumulative returns for the US and GLOBAL models.
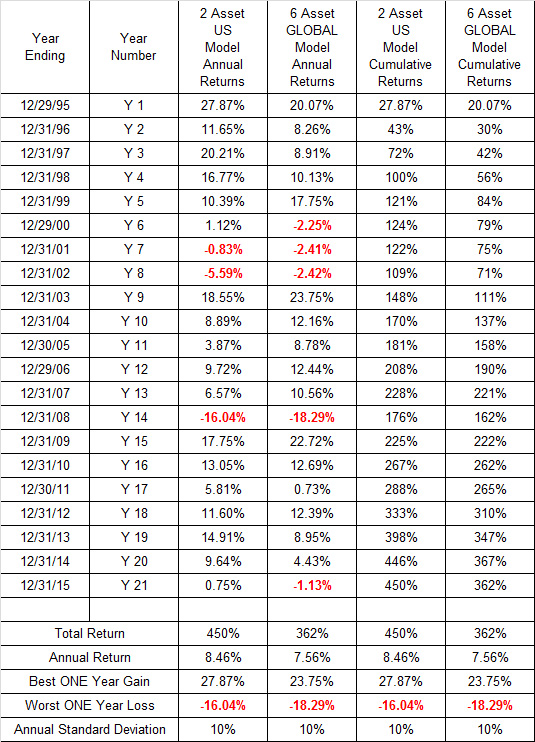
The data in the table above show that the US Portfolio outperformed the Global Portfolio by substantial margins. Furthermore, at no point during the entire period did the cumulative return of the Global Portfolio exceed the cumulative return of the US Portfolio. Based on the period shown above, you could reasonably conclude (especially if you were a US resident), that investing outside the US is something that is promoted only by feeble minded academicians.
Will US outperformance continue?
The answer is that unless you have the ability to predict the future, you cannot be sure that an economy that has outperformed over the last ten or twenty years, will outperform over the next ten or twenty years. Past performance is not a valid indicator of future performance. If it were, then investing would be easy and everyone would be rich, but that is clearly not possible.
That's why intelligent investors diversify.
Furthermore, during the years after 1994 there were a considerable number of TEN year periods during which the Global Portfolio outperformed the US Portfolio by substantial margins. The chart below shows the TEN YEAR TOTAL returns of each portfolio since 1994
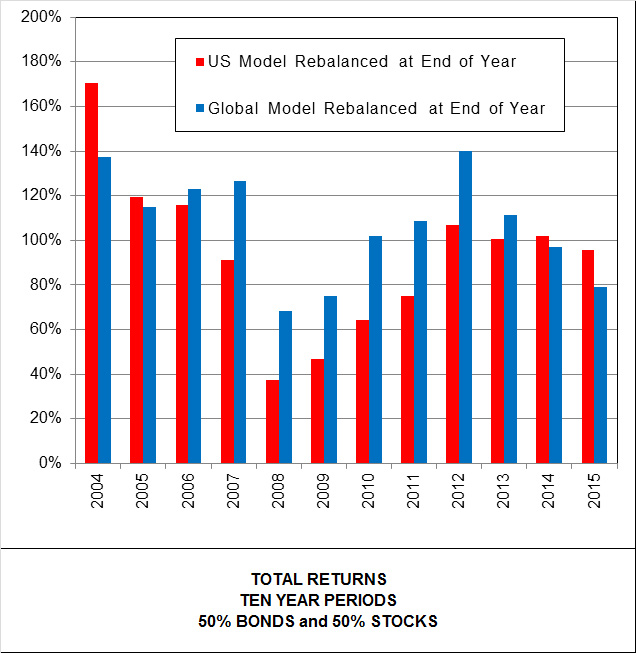
The chart above shows that the Total Return of the Global Portfolio over Ten Year Periods is frequently greater than the Total Return of the US Portfolio over the same Ten Year Period.
The bottom line is that it is simply not possible to identify either the best or the worst performing asset class before the facts are known. The best any investor can do is to identify asset classes that have a reasonable chance of performing well in the future, place your bets, and then hope for the best.
How frequently should a portfolio be rebalanced?
It is extremely difficult to optimize rebalancing frequency because you will never know when stocks have stopped rising or falling until you have the wonderful benefit of hindsight. My data, and the data of others show that yearly rebalancing is generally better than quarterly rebalancing, but rebalancing a portfolio when the bond component has exceeded 5% of its target value at the end of every quarter is a reasonably good compromise.
Rebalancing data for the Global
Portfolio over the 21 Year Period ending Dec 31, 2015
313% Total return if bought and held
347% Total return if rebalanced quarterly
362% Total return if rebalanced at the end of every year
369% Total return if rebalanced at the end of any quarter during
which the bond component exceeded its target value by more than ±5%
(There were 13 rebalancing events)
Rebalancing data for the US
Portfolio over the 21 Year Period ending Dec 31, 2015
415% Total return if bought and held
447% Total return if rebalanced quarterly
450% Total return if rebalanced at the end of every year
450% Total return if rebalanced at the end of any quarter during
which the bond component exceeded its target value by more than ±5%
(There were 11 rebalancing events)
Over the 21 Year period ending December 31, 2015
The Vanguard 500 Fund returned 551% or 9.33% per year
The Vanguard Extended Market returned 662% or 9.87% per year
Vanguard Developed Europe returned 332% or 7.22% per year
Europe’s performance has been disappointing
Vanguard Developed Pacific returned 44% or 1.76% per year
The Developed Pacific has been the biggest disappointment in modern financial history. Most of the failure can be attributed to Japan.
Japan’s share of the index declined from 75% ten or so years ago to about 60% today. In 1989 the Japanese Nikkei crashed, and since then there have been many rallies,
but the bottom line is that the Nikkei still hasn’t regained half its value since 1989
Vanguard Emerging Markets returned 201% or 5.39% per year
A few short years ago, everyone believed emerging markets were the best bet for the future.
Now everyone is bailing out of all emerging markets.
Are Emerging Markets a bargain, or will they share Japan’s fate?
Will the US share Japan’s fate?
We are all living in interesting times.