Mutual Funds and Exchange Traded Funds aka ETFs
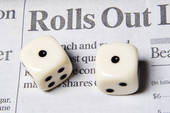 |
Snake eyes is rolling the dice and getting only
one pip on each die. The ancient Romans referred to this as "The dog throw". |
If you misspent your youth as I did, then you know that this roll will almost always be a loser. According to the Urban Dictionary, snake eyes also defines the number 1.1
That is, my grade point average this year was snake eyes.
Snake eyes are commonly experienced by owners of actively managed mutual funds.
What's an actively managed mutual fund?
The manager of the fund makes specific investments with the goal of outperforming an investment index.
What's a passively managed mutual fund?
The manager of the fund replicates the returns of that index as closely as possible.
The Rochester, New York Mutual Fund Special Interest Group, now known as the Financial Planning Special Interest Group, conducted a Five Year Mutual Fund Research Project from January 1996 thru March 2001
Here's what we learned:
The body of evidence – some would say brute evidence – that actively managed mutual funds are one of the worst possible investments any investor could make is so abundant that it defies substantive rebuttal.
I will share some of that evidence with you and I will share a number of facts with you. The most important fact I will share with you is this:
 |
If you buy actively managed mutual funds, then you will almost certainly under-perform an appropriate index by a MINIMUM of 2% per year, but you will probably under-perform by more. |
If you can remember that FACT, and if you invest accordingly, you will probably save a great deal of time and money.
The evidence to support the preceding statements will follow, but before I get started, let me tell you about a New York State lottery ticket I bought in 1974.
 |
Buying Lottery Tickets |
One of the first computer programs I wrote was based on the rules that were printed on that ticket. That program convinced me one had to be either delusional, self destructive or learning disabled to buy a New York State lottery ticket.
There may be a good reason to buy a lottery ticket, but only one thing is certain:
Everyone who buys a lottery ticket knows who the winners are going to be before they buy the ticket.
I'm going to repeat that because it's worth repeating.
Everyone who buys a lottery ticket knows who the winners are going to be before they buy the ticket.
The winners are going to be the folks who sell the tickets!
So, knowing that failure is virtually guaranteed,
Why would anyone buy a lottery ticket?
One explanation is that we humans have been programmed to fail because most of us believe we can beat the odds, even though that belief fails the simplest test of logic imaginable.
What's the relationship between actively managed Mutual Funds and Lottery Tickets?
Most folks know that lottery tickets are not a good investment, but most folks would not put actively managed mutual funds and lottery tickets into the same category.
However, they are indeed in the same category. Both seductively imply that they are going give you more than you can reasonably expect, and both generally fail to deliver on their implied promises.
What's a reasonable expectation?
Many of us probably believe a return of 10% is reasonable because 10% returns have been relentlessly promoted over the last thirty or so years, and more importantly, are still being promoted today. However, the BIG question is:
Is it REALISTIC to expect 10% Stock Market Returns in the future?
I have been recording US Gross Domestic Product Growth Rates since 1994. The average GDP Growth Rate since 1994 thru 2010 is 2.6%. The max was 4.8% in 1999. These data were supplied by the Bureau of Economic Analysis at the US Department of Commerce. Yearly data are available after 1928; quarterly data are available since 1946.
These growth rates have been adjusted for inflation. So, in order to determine realistic future stock market returns, some assumptions are gonna have to be made:
Assumptions
1. Data supplied by the US Government are accurate.
2. Past GDP Growth Rates are a reliable predictor of Future GDP Growth Rates.
3. Stock Market Returns and GDP Growth Rates are reasonably well correlated.
4. Stock Market Returns will compensate for inflation in the future.
5. Inflation will remain "under control" at a post WW2 average of about 4%
6. Stock Market Dividends will NOT revert to their post WW2 mean of about 3.5%, but will probably average about 2% in the future, which is where they are now.
7. Economic disasters will not occur again anytime soon.
If you agree with the assumptions, then here is a SIMPLE formula for realistic future stock market returns:
Stock Return = GDP Growth Rate + Inflation Rate + Dividend Rate
Stock Return = 2.6% + 4% + 2% = 8.6%
The Scenario I have just painted is the Rosy Scenario
Is the Rosy Scenario a Realistic Scenario?
About two times a month I have breakfast with a group of retired friends. While we were still working, it was dinner instead of breakfast, and we almost always talked about women. Now, we hardly ever talk about women.
Oh God, how I wish I were young again.
Now we talk about much more important stuff: The economy, the stock market, the political situation, our medical problems, and just about anything else Retired Old Men Eating Out talk about. Note that ROMEO is an acronym for Retired Old Men Eating Out.
ROMEOs are now eating out regularly in almost every state.
 |
ROMEOs Waiting for the Server |
We are not exactly a diverse group by contemporary standards, but our political opinions range far and wide. One of our regulars is about one mile to the right of Genghis Khan, but most of us are firmly planted in the center. A few of us are even an inch or two left of center, but our old age has taught us to be tolerant of one another.
However, regardless of our political inclinations and backgrounds, there is one thing about which we are in UNIVERSAL agreement:
The Young Folks of this Country owe us Everything!
We have made sacrifices all our lives to ensure their existence, and we are not willing to sacrifice one single dollar we have acquired, nor are we willing to sacrifice anything to which we are entitled.
Young Working Class Americans are responsible for cleaning up the mess Wall Street and our Politicians have made.
As Walter Cronkite used to say: "That's the way it is."
In my opinion, that thought has some disturbing implications for the future, and the Rosy Scenario may not be appropriate.
Regardless of all that, intelligent investors assess their chances of obtaining favorable returns and they invest their money accordingly.
The only reason for buying an actively managed mutual fund is that there is an expectation that the fund is going to outperform the index with which it is associated.
Here are five facts that may help you understand why the chance of winning with an actively managed mutual fund is not favorable. Note that these are FACTS; not opinions. Some folks who should know better wanna argue about these FACTS. If you wish to argue, then email me, but remember this:
As an American, you are entitled to your own opinion regardless of its validity, but you are not entitled to your own FACTS.
FACT #1
Gambling, or investing, in the stock market is a zero sum game. That is, for every dollar that out-performs the market there must be a dollar that under-performs the market.
It’s been a game worth playing because the market has, over time, increased in value. This provided a positive bias to the zero sum game. If we are all lucky the bias will stay positive. Most of us know that luck is a very important factor in life.
FACT #2
Investors as a group cannot outperform the market, because they are the market.
FACT #3
Investors as a group must under perform the market because of trading costs.
FACT #4
Passive investors have lower trading costs than active investors.
FACT #5
The entire population of passive investors must outperform the entire population of active investors because of the trading cost differential.
The preceding self-evident realities wouldn’t matter if experienced professional managers were able to take advantage of bunglers and amateurs. But in highly efficient markets that does not happen; it doesn’t happen because it’s the professionals who set the prices that are paid by expert and novice alike. The record is clear that all major markets are indeed highly efficient. A major market is essentially any market that has a reasonably well known index.
The preceding facts explained that active managers have a considerable handicap relative to a passively managed index, but the BIG question is:
How many professional managers transcend the handicap?
Studies generally conclude that 80% of professional managers fail to outpace appropriate market indexes. And, those who do so rarely repeat their success in the future. Later on I'll give you some data from a study that was conducted at the University of Southern California that showed that more than 95% of mutual fund managers failed to outperform the market from the early sixties through the late nineties.
Earlier I said: Gambling, or investing, in the stock market is a zero sum game.
What's the difference between a gambler and an investor?
There are many definitions, but they all essentially mean this:
 |
Gambler
One who puts money at risk in the hope of obtaining an income or profit |
 |
Investor One who puts money at risk in the hope of obtaining an income or profit |
The definitions of gamblers and investors are identical. Furthermore, it's obvious that gamblers and investors are playing the same game, whether they're betting on lottery tickets, games in a casino, mutual funds, stocks, bonds or anything else involving profits and losses.
But there MUST be a difference. Walk into a casino. Can you tell the difference between the gamblers and the investors?
The investors know exactly what the chances of winning and losing are, and they simply do NOT play the game unless the odds are favorable. They are usually the owners of the casino.
The gamblers don't know or care what the odds are. They are playing because they enjoy the excitement. The owners love their customers. They publicly refer to them as patrons, or players, or clients, but when they speak about their customers privately, they are probably not as generous with their descriptive assessments.
So, what about you?
Are you a gambler or are you an investor?
|
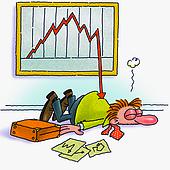
|
The data show that if you buy actively managed mutual funds, then you are a gambler. |
Let's look at some data.
From January 1996 thru March 2001 the Rochester, NY Mutual Fund Special Interest Group (SIG) conducted a Five Year Mutual Fund Research Project.
The objective of the project was to determine if outperforming mutual funds could be identified before their outperformance was a known fact. That is, anyone can identify a winner after the race is over, but is it possible to identify the winner before the race starts?
During the first three months of 1996 the Mutual Fund SIG compiled a list of actively managed US funds which we believed had a reasonably good chance of outperforming appropriate indexes.
The actively managed funds were chosen because they either had a history of above average performance or were relatively young funds managed by someone with outstanding credentials.
Initially we wanted a fund category for each of the nine Morningstar style boxes, but it soon became apparent that almost all actively managed funds were a blend of growth and value, so we compromised by selecting the following three index funds as benchmarks:
1. The Vanguard 500 Index Fund
2. The Vanguard Extended Market Index Fund
The Extended Market consists of all US companies outside the S&P 500 and is classified as a mid blend fund. The entire US Stock Market consists of the S&P 500 and the Extended Market.
3. The Vanguard Small Cap Stock Index Fund
The SIG's members nominated actively managed funds, and the SIG then voted on the nomination. It took the SIG three months to carefully select about twenty funds for each of the first three lists.
Performance data were reviewed every quarter. New funds were added, and old funds were deleted, but only if they had been held for at least one year. An average of twenty actively managed funds were chosen for each of the three categories every quarter.
All funds were carefully selected by using fund selection criteria the SIG developed. Each SIG member had at least two weeks to evaluate the funds that were nominated for addition or deletion. SIG members were encouraged to carefully evaluate the funds and they were encouraged to condemn any funds that had known flaws.
The SIG contained a diverse group of 15-20 active participants during this period. We had some engineers and statisticians who were using sophisticated optimization techniques to identify good funds, an MD who was well on his way to Chartered Financial Analyst certification, a scientist who was managing his own financial advisory service, a Veterinarian who had a good investing background, attorneys, teachers and various others.
Here are Five Years of results that represent the SIG's best efforts.
The first value is the TOTAL FIVE YEAR RETURN thru March 31, 2001
93.8% Vanguard 500 Index (14.2% Annual Return)
62.5% SIG's Picks (10.2% Annual Return)
47.6% Vanguard Extended Market Index (8.1% Annual)
29.9% SIG's Picks (5.4% Annual Return)
52.2% Vanguard Small Cap Index (8.8% Annual)
15.8% SIG's Picks (3.0% Annual Return)
Five years of data thru March 2001 show the SIG trailed the indices by an average of more than 4% per year.
I carefully checked every fund every quarter to be absolutely certain that it was in the proper category. The SIG trailed the Large Cap index by 4% per year and the Extended Market Index by 2.7% per year.
Many investors believe that it is easy to outperform a small cap index because the conventional wisdom proclaims that small cap stocks are not efficiently valued. The fact that the SIG under-performed the Small Cap Index by 5.8% per year raises at least one question about the credibility of the conventional wisdom. Regardless, one set of results is not enough to resolve this issue, but I have never seen any evidence to substantiate the belief that some indices are easier to outperform than others.
The results of our project surprised me. It's pretty safe to say that none of us expected to trail the indices by more than four percent per year. Obviously, no one felt too good about our results, but I believe that our project was an unlimited and unqualified success because our project confirmed what every other research project about mutual funds has shown:
|
|
If you buy actively managed mutual funds, then you will almost certainly under-perform an appropriate index by a MINIMUM of 2% per year, but you will probably under-perform by more. |
If you can remember that FACT, and if you invest accordingly, you will probably save a great deal of time and money.
During our project many funds were added, and in some cases erroneously deleted from the lists. We aren’t the only ones to remove funds from portfolios after a year or two of bad performance:
Dalbar, a Boston fund research firm, studied returns at hundreds of funds in the twenty years from 1984 through 2003. By comparing fund performance with the amount of cash that flowed in and out, Dalbar was able to calculate how much money the average investor earned.
Here's what the typical stock fund investor does:
Step 1. Purchase a winning fund
Step 2. Patiently wait an average of three or four years for it to outperform
Step 3. Sell it in disgust
Step 4. Buy another “winner”
Step 5. Repeat steps 2 thru 4 over and over again
And, here are the results of that behavior:
The S&P 500 returned an annual average of 12.98% during the twenty years from 1984 thru 2003.
The typical stock fund investor earned only 3.51% annually!
That's almost unbelievable.
That means the typical stock fund investor trailed the S&P 500 by almost 10% per year!
Regardless, after five years of precisely monitoring performance, absolutely no SIG member was willing to nominate funds for either addition or deletion because everyone now realized that there are simply no criteria for determining a funds future performance.
Past performance, as stated in all the prospectuses, is not an indicator of future results.
Here's more data: Lipper Analytical Services currently monitors about 10,000 mutual funds. In August 1998 only 360 of these funds had been around for 15 or more years. Only 22 of the 360, or 6.1%, have beaten the returns of the Vanguard S&P 500 fund.
But there is even less here than meets the eye. Fund families discard their losing funds and keep only the winners. This significantly biases the results by making the actively managed fund industry look a lot better than it really is.
This survivorship bias is extremely important when quantifying fund performance. Professor Mark Carhart of the University of Southern California has studied fund attrition rates back to the early 1960s. He discovered that, on average, 3.6% of all mutual funds stop trading each year. That means that nearly half the funds that traded 15 years ago no longer exist. You can be certain they weren’t dropped because they were top performers.
The bottom line here is that fewer than 4% of the funds studied by Mark Carhart beat the market.
How good is Morningstar at picking winners?
Over the ten year period ending December 31, 2010
Morningstar's Mutual Fund selections returned 5.3% per Year
The Vanguard S&P 500 Index Fund returned 1.3% per Year
Morningstar's ten year record has improved considerably since I checked it two or three years ago, and Morningstar's selections look good when they're compared to the S&P 500, but the S&P 500 was the worst performing major asset class over the ten years ending December 31, 2010.
The average Vanguard fund return of the S&P 500, US Small Caps, Europe, the Pacific and Emerging Markets was 6.5% per year.
An Intermediate Term Bond Index fund also returned 6.5% per year.
An asset allocation model using these assets with a 50% bond allocation, and rebalanced quarterly, returned 7.2% per year.
If you need more evidence that actively managed mutual funds are one of the worst possible investments any investor could make, then read John Bogle’s book, Bogle on Mutual Funds, but if actively managed mutual funds are not the answer to an investor's prayer, then what is?
Once again, the S&P 500, including dividends was the worst performing asset class during the ten years ending December 31, 2010
That's NOT what the experts were predicting ten years ago. One of the most popular predictions ten years ago was that buying the S&P 500 would give you all the foreign exposure you needed because the S&P 500 was a multi-national index.
Another popular prediction was that you could safely ignore bonds until the DOW hit 30,000, but that has not stopped the latest crop of financial prngraphers from making even more ridiculous predictions today.
My objective is to optimize my rate of return. An overwhelming body of academic evidence has demonstrated that the best way to optimize a return is to use an Asset Allocation strategy.
Most investors don't have a strategy that can survive a careful examination. Most investors don't even have a written strategy. I can tell you this with a high degree of certainty:
If you do not have a written strategy, then you simply do NOT have a strategy.
If you do NOT have a strategy, then you may win the occasional investing battle, but you will almost certainly lose the investing war.
I have been using a global asset allocation strategy for my core portfolio since 1997, but I have back tested it to 1969. The longer I use this strategy, the more convinced I am that there are very few strategies that are going to outperform the global model on a risk adjusted basis over the long term, meaning a ten year MINIMUM period.
Longer is better, but by now everyone should know that ten years is NOT a long time if you're trying to evaluate an investing strategy.
(I believe that a comprehensive understanding of asset allocation is probably the most important thing any investor should know. For more go to Asset Allocation)
In the meantime,
Here are THREE recommendations:
ONE: Determine your measurable written investing objective. Believe it or not, most investors don't have an objective that can be quantified. It is NOT possible to determine either success or failure if you do not have a measurable objective.
An example of an unquantifiable objective
I have $10 now, but at the end of this year I wanna be much, much richer.
What's wrong with the objective?
Much, much richer is not defined i.e., it could mean almost anything.
An example of a quantifiable objective
I have $10 now, but at the end of this year I wanna have $10 million.
TWO: Develop a written strategy to achieve your investing objective.
If a quantifiable investment objective is unrealistic, then it will quickly become obvious during the development of your strategy.
THREE: If success is defined as outstanding performance, remember that it is extremely rare in life.
Malcolm Gladwell wrote a NY Times bestseller called Outliers. An outlier is someone outside the normal distribution curve.
The book compiled research done on outliers, and suggested that one of the keys to success in any field is to practice for 10,000 hours. It helps if you're autistic because normal humans, known as neurotypicals, seldom have enough patience, perseverance and discipline.
Exchange Traded Funds versus Mutual Funds
How they're the same
Both cover a wide range of stock & bond market segments, investment styles, sectors, and industries.
How they're different
**********************************************************************************************************
● ETFs are Bought & Sold thru a broker.
● Mutual Funds are generally Bought & Sold thru the fund's family.
**********************************************************************************************************
● ETF share prices fluctuate throughout the trading day.
● Mutual funds are priced once a day after the financial markets close
**********************************************************************************************************
● Some brokers charge transaction fees to trade ETFs, but most brokers have eliminated many ETF transaction fees.
● There are generally no transaction fees when Mutual Funds are purchased or redeemed directly from the fund family, but some funds have front or back loads. Avoid them.
**********************************************************************************************************
● ETFs can be traded at any time during normal trading hours.
● Mutual Fund orders are processed at the closing Net Asset Value
**********************************************************************************************************
 |
Tax Advantages of ETFs |
Yuk! You know you're getting old when Uncle Sam looks like a kid.
All mutual funds accumulate unrealized capital gains. Actively managed mutual funds generally trade frequently. When stocks that have appreciated are sold by the fund's manager, the fund distributes the capital gains.
That's the reason many actively managed mutual funds are extremely tax inefficient
Actively managed ETFs are significantly more tax efficient than actively managed mutual funds because, through a regulatory loophole, all trades executed by the ETF manager are called in-kind trades. According to the IRS, this exchange of legally identical items does not trigger capital gains.
However, ETFs may not be as tax efficient as you'd like. At present, qualifying dividend distributions from stocks are taxed at a preferentially low tax rate in the United States. One of the requirements to qualify for this low rate is that the stock has been held for at least 60 days. Due to share creation activity in ETFs, this standard may not be met all the time. Thus, a portion of the dividend income distributed by the ETF may not qualify for the preferentially low tax rate for qualifying dividends.
Index ETFs are generally slightly more tax efficient than Index Mutual Funds, but some Index Mutual Funds are not as tax efficient as others.
For example, a growth or value Index Fund that is frequently rebalanced, is not as tax efficient as its blended parent.
Three other Considerations when Contemplating ETFs
ONE: Sector ETFs may have different expense ratios and returns.
For example, ETFs that track Financials had expense ratios that varied from 0.2% to 0.7% during 2010, and returns that varied from 12% to19%.
TWO: Some ETFs are thinly traded. That normally results in a high bid-ask spread. There may also be slight differences between the Net Asset Value and the Market Price of a thinly traded ETF. That could be a problem for frequent traders of thinly traded ETFs.
THREE: Commodities and their ETFs are hot, and they have been hot for a long time. Many investors have attempted to capitalize on the commodity craze by buying a commodity ETF.
The SEC has been overwhelmed with complaints from naive investors who thought they bought a commodity index ETF, but instead bought an actively managed ETF that employed contango and backwardation in an attempt to outperform a simple index.
Contango and Backwardation: Doesn't that just sound wonderful?
Contango with me, and you and I will make a pot of money, and we're gonna have fun doing the Contango together.
 |
Most of you probably know that the Tango was reputedly invented in the brothels of Argentina sometime during the early Twentieth Century in order to separate the customers from more of their money. |
I wish I could tell you that the Contango was invented in the brothels of Wall Street, but I cannot. That honor goes to our cousins in London, but the Contango is also used to separate the customers from more of their money.
The problem with a Commodity Fund is that it is NOT easy to manage. If you're the fund's manager, here are your choices:
ONE: Buy the commodities whose performance you're attempting to replicate, and then store them someplace.
Some Precious Metals funds do exactly that, but it is probably not a wonderful idea for most commodities because of the storage costs, the insurance costs and all the other costs that will probably overwhelm the fund.
TWO: Buy shares in the corporations that mine and process the commodities.
Some commodity funds do exactly that, but the prices of the corporations may not be well correlated to the prices of the commodities.
THREE: Invest or gamble in the futures markets.
That's exactly what most commodity funds do, and that's when the Contango and Backwardation contest begins.
Contango is when the futures price is above the expected future spot price.
Normal Backwardation is when the futures price is below the expected future spot price.
Guess right and you're gonna make a pot of money.
Guess wrong and you're gonna lose a pot of money.
In 1991 a German company (Metallgesellschaft AG) hired Arthur Benson, a London derivatives trader, to manage the risk of their Energy Group. In 1993 they revealed that they lost about $1.5 billion dollars, mostly because Arthur Benson used a hedging strategy that profited from normal backwardation, but he did not anticipate a shift to contango markets.
If you want to amuse yourself, then Google
Commodities, Contango and Lawsuits
That will be far more entertaining than football or the weather.
March 31, 2001
Revised March 2011