
Is there any way to limit losses?
That is probably the question that gets asked most frequently, and limiting losses is probably something that is attempted by almost all investors at some time in their investing careers.
Brokers and other "experts" lead many investors to believe that losses can easily be limited with Stop Loss Orders. This belief is likely to enrich your broker, but the data below show that you are far more likely to limit profits when you attempt to limit losses.
What happens when you try to limit the losses of a WEIMERandWIRTH portfolio?
I examined all the picks that were candidates for dissemination to subscribers from 2010Q1 thru 2013Q4 i.e., four years of picks. The data directly below show that returns would have been optimized if picks that fell 40% from their purchase price had been sold, but that value is an average value. The optimal drop is heavily dependent on market conditions during the quarter.
The data also show that if picks had been sold when they fell 10% from their purchase price, then returns would have been severely compromised. This is noteworthy because brokers and self-styled experts frequently recommend selling a stock after it falls 10% to limit losses.
Data for 1,346 picks chosen during 2010Q1 thru 2013Q4
Normal 3 month average return for these picks was a gain of 9.8%
3.6% gain if all that fell 5% or more had been sold
5.7% gain if all that fell 10% or more had been sold
8.0% gain if all that fell 15% or more had been sold
9.1% gain if all that fell 20% or more had been sold
9.4% gain if all that fell 25% or more had been sold
9.6% gain if all that fell 30% or more had been sold
9.7% gain if all that fell 35% or more had been sold
9.8% gain if all that fell 40% or more had been sold
9.8% gain if all that fell 45% or more had been sold
9.8% gain if all that fell 50% or more had been sold
9.8% gain if all that fell 55% or more had been sold
9.8% gain if all that fell 60% or more had been sold
9.8% gain if all that fell 65% or more had been sold
9.8% gain if all that fell 70% or more had been sold
9.8% gain if all that fell 75% or more had been sold
9.8% gain if all that fell 80% or more had been sold
9.8% gain if all that fell 85% or more had been sold
9.8% gain if all that fell 90% or more had been sold
Stop loss order results above were found by examining the daily high-low prices of the picks during the first 25 trading days after they were purchased. After 25 trading days, the daily high-low prices were checked every 5 trading days i.e., at 30, 35, 40 etc. thru 75 in 5 trading day increments. These results may be too optimistic because the results assume that the stocks can be sold at the precise drop shown above. In fact, the order will be placed after the price has fallen by the amount shown above i.e., the true sale price will almost certainly be lower than the drops shown above. In the future, high-low prices will be examined every trading day instead of every 5 trading days after Day 25, but data from 2013Q4 that were checked every day suggest the error above will be under 0.2%.
However, there are definitely circumstances under which premature selling will save a pot of money. If you know the market is going to decline during the next three months, then get out, or better yet, short the market. The problem, of course, is that nobody knows where the market is going to be in the next three months, or even in the next three minutes.
What about TRAILING stops?
A Trailing Stop Sell Order sets the stop price at a fixed amount below the market price with an attached "trailing" amount. As the market price rises, the stop price rises by the trailing amount, but if the stock price falls, the stop loss price doesn't change, and a market order is submitted when the stop price is hit. This technique is designed to allow an investor to specify a limit on the maximum possible loss, without setting a limit on the maximum possible gain.
Data for 1,346 picks chosen during 2010Q1 thru 2013Q4
Normal 3 month average return for these picks was a gain of 9.8%
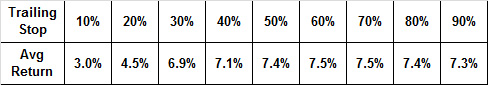
The table above shows that Trailing Stop Sell Orders are less likely to add value than plain vanilla Stop Loss Orders. In fact, they will almost certainly subtract value.
Trailing Stop Sell Order results above were found by a program that examined the daily high-low prices of the picks during the first 25 trading days after they were purchased. After 25 trading days, daily high-low prices were checked every 5 trading days i.e., at 30, 35, 40 etc. thru 75 trading days in 5 trading day increments. The program identified the latest max value after the stock was purchased. If subsequent values fell by a value greater than the trailing stop, then the stock was sold at that value i.e., normally the day’s low price. This is probably (arguably) fairly realistic. In the future, high-low prices will be examined every trading day instead of every 5 trading days after Day 25, but data from 2013Q4 that were checked every day suggest the error above will be under 1.0%.