
Market Timing
There are two Holy Grails of investing: Timing the Market and Stock Selection.
Technical analysts look at charts consisting of historical data because they believe the future performance of a stock or a stock market can be predicted by examining the patterns of the past. Sometimes these naive forecasts seem to work, but most stock market analysts believe that the primary function of technical analysis is to increase brokers' commissions.
I was asked to evaluate a market timing strategy that either held the S&P 500 or a Short Term Treasury ETF during the Ten-Years ending with December 31, 2010. I was reluctant to evaluate the strategy because I more or less agreed with the conventional wisdom regarding technical analysis, but I finally agreed to do it.
This timing strategy is described in The Ivy Portfolio where it is called "The Quantitative System" of market timing.
The Ivy Portfolio authors mention that Jeremy Siegel describes the 200 day Simple Moving Average in his book Stocks for the Long Run. Siegel's test bought the DJIA when it closed at least 1% above its 200 day Simple Moving Average, and sold the DJIA and invested in Treasury Bills when it closed at least 1% below the 200 day Simple Moving Average. This 1% buffer reduces the number of required switches into and out of the market.
The 200 day Simple Moving Average (SMA) System was also described in the Hulbert Financial Digest. In this article, Hulbert mentioned that the popularity of the 200 day Simple Moving Average in recent decades can be traced largely to Richard Fabian, who during the 1970s began championing a 39-week moving average (virtually the same as a 200 day Simple Moving Average). At the time, Fabian was editor of the Telephone Switch Letter, an advisory service that has since gone through several metamorphoses and is now edited by his son, Douglas Fabian, and called Doug Fabian's Successful Investing.
Hulbert also wrote that a 52-week moving average system (virtually the same as a 250 day Simple Moving Average system) would produce better long-term returns than the 39-week system. My data for the S&P 500 confirm that claim.
Note that this simple timing system has been used by the Fabians for more than 30 years. It is also reputedly being used by the High Falls Advisors in Rochester, NY, where it is being touted to Kodak retirees as a system that avoids bear markets. The Ivy Portfolio authors make the same claim.
I wrote a Microsoft Excel Visual Basic Applications (VBA) program to test this system.
Here's what I learned:
The 250 day Simple Moving Average System with a 3% buffer produced the best long-term returns for the S&P 500, so that system was used for all my results. A 170 day SMA with a 5% buffer works about as well as the 250 day SMA with a 3% buffer. A buffer (explained above) reduces the number of required switches into and out of the market.
The ten-year period ending December 31, 2010 was the absolute best ten-year period for this market timing strategy during the fifty-five years ending December 31, 2010. That fact probably explains why so many investors have been attracted to this market timing strategy lately.
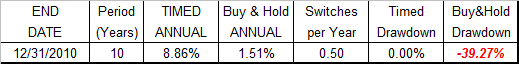
Incredibly, a 3% buffer decreased the average number of switches from 6.9 per year to 0.5 per year AND it increased the return from 5.39% per year to 8.86% per year. Dividends are included in all S&P 500 returns shown here. This is absolutely astounding when compared to a Buy & Hold the index strategy that returned a mere 1.51% per year during this ten-year period. And, the timed strategy made it through the entire ten-year period without a loss, but at one point, the Buy & Hold Strategy was down a heart stopping 39.27%. Note that drawdown is the worst loss that an investor would have experienced if the portfolio had been liquidated during the period under examination.
However, if the ten-year periods ending Dec. 29, 2000 and Dec. 31, 1990 are examined, then a completely different set of data emerge.
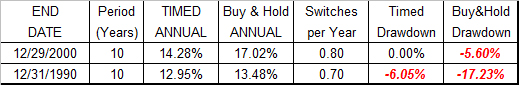
The data in the table above show that implementing the 250 day Simple Moving Average system with a 3% buffer during both ten-year periods shown was a waste of time and money. How well would the 250 day Simple Moving Average system with a 3% buffer have worked during the entire 55-year period ending Dec. 31, 2010?
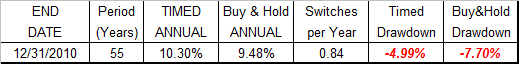
The data in the table above show there was a modest advantage of less than 1% per year for Market Timers, but they had to switch into and out of the market an average of 0.84 times per year to obtain the advantage.
However, and this is important, if a severe bear market occurred during any five-year period, the bear market losses were significantly reduced. The WORST bear market loss for the timed portfolio during any of the 11 five-year periods ending with 2010 was 6.05%.
Here are the worst bear market losses (called drawdown) for the Buy & Hold Portfolio:
40.89% drawdown during the five-year period ending with 2010
39.27% drawdown during the five-year period ending with 2005
17.23% drawdown during the five-year period ending with 1985
22.49% drawdown during the five-year period ending with 1975
18.36% drawdown during the five-year period ending with 1970
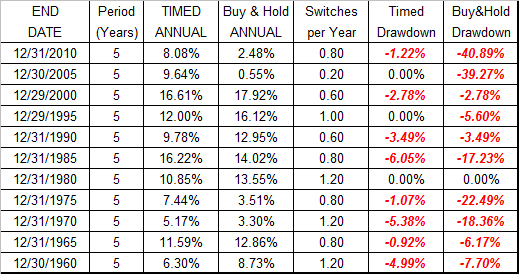
The bottom line is that if the 11 five-year periods (a total of 55 years) ending with December 31, 2010 are examined, and if a 3% buffer is used to limit the number of switches to an average of less than one switch per year, then the Timing Model outperformed during 5 of the 11 periods, and the Buy & Hold Model outperformed during 6 of the 11 periods. See the Table below.
The Table below shows all 11 of the five-year periods of the S&P 500. A 250 day Simple Moving Average with a 3% buffer was used for the Timed Portfolio. Dividends are included in all returns. Once again, drawdown is the worst loss that would have been realized during the five-year period.
Should you bet the farm on this strategy or are these results simply a remarkable coincidence that is comparable to the Hemline Theory?
The Hemline Theory
Financial analysts have loosely used it to determine where the economy is headed. So far it’s been pretty accurate. In the ’20s and ’60s, hemlines were at a high and so was the stock market. And in the ’30s and ’40s, the stock market was so low that women were almost tripping on their skirts. The hemline theory was also on the ball in 1987. Miniskirts were all the rage, and the stock market was at a matching high. But then the market quickly crashed in October, right when designers such as Bill Blass decided that miniskirts looked ridiculous. Hemlines dropped and so did the market. Coincidence?
I'm not going to bet the farm on either one of these strategies anytime soon, but I will be monitoring the S&P 500's 200 and 250 day Moving Averages carefully in the future.
We'll see...
Some troubling aspects of any market timing system.
1. Past Performance Does Not generally Predict Future Performance in the Stock Market game. If it were that simple, then everyone would be rich, and that is clearly not possible.
2. A move into or out of the market in a taxable account is generally a taxable event.
That fact probably makes any timing system unsuitable for taxable accounts.
3. When a system is examined dispassionately, and when you have the wonderful benefit of hindsight, then it is fairly easy to claim that you are going to move your entire portfolio (or at least a major part of it) into or out of the market. However, most market timers I know are constantly second-guessing themselves. That's because most investors are extremely reluctant to make big bets on anything, primarily because it's instinctive, but more importantly, big bets violate diversification precepts.
Here's some advice from Benjamin Graham, Warren Buffet's mentor and probably the greatest value investor of the 20th Century: "The investor should always have a minimum percentage of his total portfolio in common stocks and a minimum percentage in bond equivalents. I recommend at least 25 per cent of the total at all times in each category. A good case can be made for a consistent 50-50 division here, with adjustments for changes in the market level. This means the investor would switch some of his stocks into bonds on significant rises of the market level, and vice-versa when the market declines. I would suggest, in general, an average seven or eight-year maturity for his bond holdings."
I am reasonably certain that it's pretty safe to write that absolutely no one would be talking or writing about any Simple or Complex Moving Average timing system if it had not been for the ten-years ending with December 31, 2010.
Here's why:
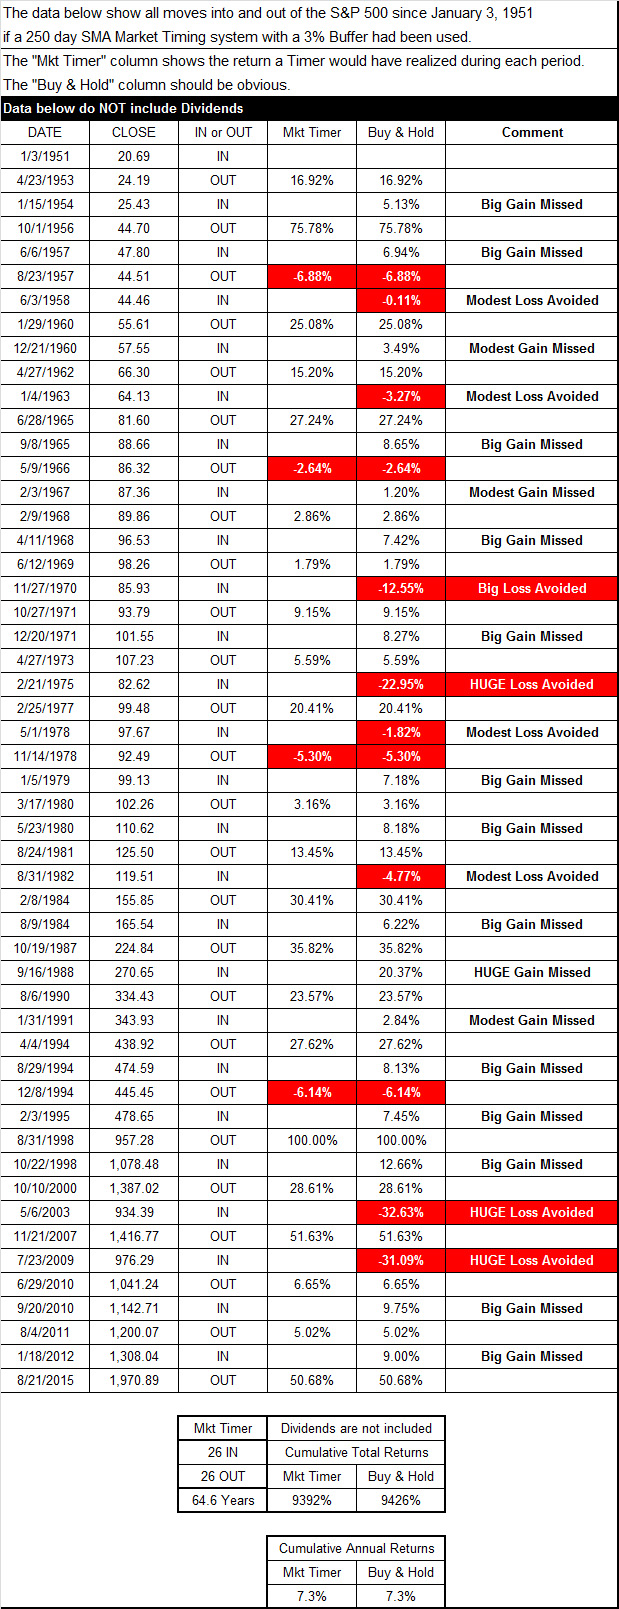
The 250 day SMA system with a 3% buffer got an investor out of the market on October 10, 2000 and back in on May 6, 2003. That move avoided a 32.6% loss (excluding dividends) of the S&P 500. The 250 day SMA system also got an investor out of the market on November 21, 2007 and back in on July 23, 2009. That move avoided a 31.1% loss (excluding dividends) of the S&P 500.
During the sixty-years ending with December 31, 2010 there was only one other period during which the 250 day SMA system enjoyed comparable success i.e., the 250 day SMA system with a 3% buffer got an investor out of the market on April 27, 1973 and back in on February 21, 1975. That avoided a 23.0% loss (excluding dividends) of the S&P 500.
Here are some negative consequences of the 250 day SMA system with a 3% buffer: The 250 day SMA system with a 3% buffer got an investor out of the market on October 19, 1987 and back in on September 16, 1988. That move avoided a 20.4% gain (excluding dividends) of the S&P 500.
There were many other periods during the last sixty years during which considerable gains would NOT have been realized if money had been taken out of the market if the timing of the 250 day SMA system with a 3% buffer had been followed. Examine the Table below to see them.
Note that ONE YEAR is equal to approximately 250 Trading Days
The bottom line is that there will always be compelling reasons for any baffling decision, but if you believe that this economy is similar to the economy that existed during late 2000 and late 2008, then get out; otherwise, hold the course. Well see...
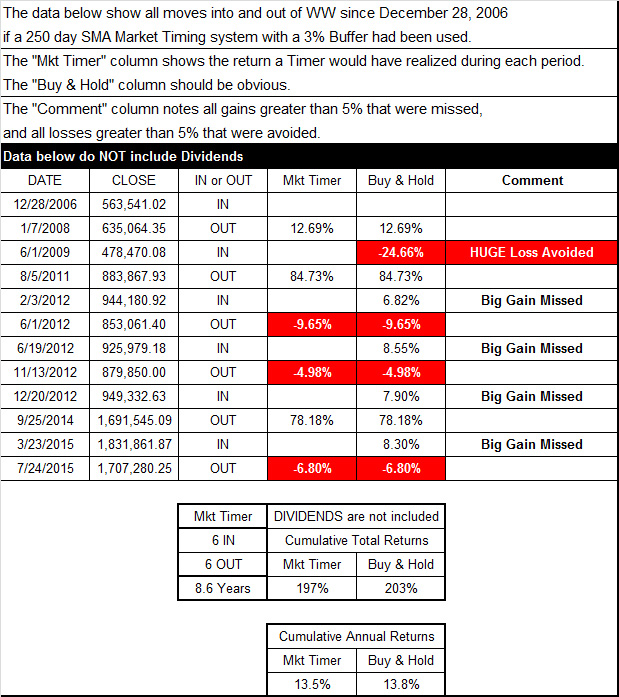
How well would the Timed Strategy have worked for WEIMERandWIRTH?
On December 31, 2015 I will have 14-1/2 years of performance data for WW. Unfortunately, I began recording daily data only after 2005 so that means that at the end of 2015 I will have nine years of daily performance data for WW.
My plan is to update the S&P 500 data as well as WEIMERandWIRTH timing data on this page after the end of 2015. Here are my WW results from December 28, 2006 thru July 24, 2015. I used July 24, 2015 as the end date because that's when a WW timer would have gotten OUT.
Here are the returns for the S&P 500 over the same period
4.5% Annual Buy & Hold S&P 500 return
6.9% Annual Timed S&P 500 return