
Weekly Reports
A detailed Portfolio Report was e-mailed to my subscribers every week. The report was an audit of all the stocks that were selected and e-mailed to my subscribers. The report kept me honest by making it impossible to lie about the returns that I reported, AND it provided my subscribers with a record to which they could refer.
The Portfolio Reports were available only to Subscribers, but the essays and notes below are some of the More Memorable Cover Pages of the weekly reports that were sent to subscribers. Normally the cover page contained only a few comments, but the cover pages below inspired some interesting responses from readers.
*************************************************************************************************
Index
Alice in Wonderland May 7, 2010
Buffett, Warren on Timing December
31, 2008
Complaints March 5, 2010
Economic Cycle May 1, 2009
Japan vs. US December 11, 2009
Rich? - Are You April 24, 2009
Siegel, Jeremy vs. S&P February 27,
2009
Stress - Trading October 30, 2009
Tax & Publicly Traded Partnerships
April 9, 2010
Trading - Frequent February 26,
2010
*************************************************************************************************
May 7, 2010 Report Cover Letter
Greetings,The latest report is attached.
 This week was one of the strangest weeks I've seen. Yesterday
(Thursday), one of the picks Doug recommended was PPCO. On Thursday
PPCO traded between zero and 3.50. I could not believe my eyes when
I saw that price range on Yahoo, so I checked the range on
Ameritrade's site. Sure enough, the low for PPCO on Ameritrade's
website was $0.0001 on Thursday. That means, for one split second
yesterday, a company that now has a market cap of over $100 Million,
had a total value of less than $4,000
This week was one of the strangest weeks I've seen. Yesterday
(Thursday), one of the picks Doug recommended was PPCO. On Thursday
PPCO traded between zero and 3.50. I could not believe my eyes when
I saw that price range on Yahoo, so I checked the range on
Ameritrade's site. Sure enough, the low for PPCO on Ameritrade's
website was $0.0001 on Thursday. That means, for one split second
yesterday, a company that now has a market cap of over $100 Million,
had a total value of less than $4,000 Strangely, Yahoo's historical quotes now show that PPCO traded at 3.45 to 3.50 on Thursday.
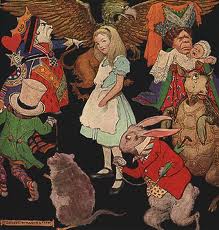
Alice in Wonderland: "I wonder if I've been changed in the night? Let me think. Was I the same when I got up this morning? I almost think I can remember feeling a little different. But if I'm not the same, the next question is 'Who in the world am I?' Ah, that's the great puzzle!"
The Cat: "We're all mad here."
Summary after Close on May 7, 2010
18 SOLD on 5/7/2010
20 PURCHASED on 5/7/2010
S&P 500 LOST 5.0% Quarter to Date
WEIMERandWIRTH LOST 0.3% Quarter to Date
NASDAQ 100 (QQQQ) LOST 5.7% Quarter to Date
S&P 500 GAINED 0.1% Year to Date
WEIMERandWIRTH GAINED 10.4% Year to Date
NASDAQ 100 (QQQQ) LOST 0.7% Year to Date
S&P 500 GAINED 0.7% annually since June 30, 2001
WEIMERandWIRTH GAINED 25.4% annually since June 30, 2001
NASDAQ 100 (QQQQ) GAINED 0.0% annually since June 30, 2001
The returns above do NOT include the current quarter's dividends.
Dividends ARE included for the S&P 500's historical data, but NOT
for the NASDAQ 100's or for WEIMERandWIRTH's historical data.
Comprehensive return data and details are in the attached report.
Regards,
Henry
Return to Index
*************************************************************************************************
April 9, 2010 Report Cover
Letter
Greetings,
The latest report is attached.
I updated the "Return History" and "Return Variability" pages of the
attached report. I changed some things that I will let you discover
yourselves. Feedback, negative or positive is always appreciated.
 The WEIMERandWIRTH model portfolio purchased BBEP on March 13, 2009
and sold it on July 31, 2009 for a 33% profit. If you purchased
BBEP, then you purchased BreitBurn Energy Partners L.P. (NASDAQ:
BBEP), which is a Publicly Traded Partnership (PTP) aka a Limited
Partnership (LP). I believe BBEP is the only PTP that was held
during 2009 by WW.
The WEIMERandWIRTH model portfolio purchased BBEP on March 13, 2009
and sold it on July 31, 2009 for a 33% profit. If you purchased
BBEP, then you purchased BreitBurn Energy Partners L.P. (NASDAQ:
BBEP), which is a Publicly Traded Partnership (PTP) aka a Limited
Partnership (LP). I believe BBEP is the only PTP that was held
during 2009 by WW.
The sale must be reported to the IRS if it was purchased in a
taxable account, but there are additional reporting requirements.
1. If you purchased a Publicly Traded Partnership, then you have
received, or will receive, IRS Schedule K-1. Note that even though
you have probably received this form during March, you may receive
this form as late as April 15. Regardless, you are required to
incorporate this information into your tax return if you purchased
it in a taxable account.
The K-1 tax information is available on the partnership's website.
That info can be downloaded and imported into TurboTax. There may be
changes to your tax liability, especially if you have a great deal
of business income and business deductions. I believe that TurboTax
handles everything after the K-1 info is imported, but if anyone
experienced problems, then please let me know; I will pass on that
info.
2. If you sold your publicly traded shares, your broker may not have
reported the sale to the partnership because I believe brokers are
not required to report sales to PTPs. IMPORTANT: If you are an
eligible owner and if you do not report the sale of your publicly
traded shares to the partnership, then the partnership may assume
you still own them and report your ownership to the IRS. Forever and
ever after…
Note that eligible owners are all owners who purchased shares of a
PTP in a taxable account, C Corps, IRAs, and Keogh Plans. You can
report the sale on-line at the PTP's website. Click on the K-1
support icon. If you have any questions, the PTPs normally supply a
toll free number on their websites.
3. If you purchased these shares in an IRA, then you probably don’t
have to report anything to the IRS, but there may be some obscure
reporting requirements. This confused me, but all the friendly folks
at the IRS I spoke with were confused too. For whatever it's worth,
the WW portfolio sold a PTP in 2007 too. All the folks I know who
held this in an IRA did NOT report anything to the IRS. As far as I
know, there were no IRS repercussions.
After this cover letter was disseminated, I
learned something new about Publicly Traded Partnerships from one of
our members who is a CPA. He wishes to remain anonymous because he
is overwhelmed with clients and work, but all the info that follows
is from him.
"Partnerships, whether they are PTPs or LPs, can be a problem even
for IRAs, employer retirement plans, and tax-exempt entities. For
most IRAs it is not likely to be an issue, but you never know. My WW
investments are in a Roth 401(k). I detected fairly quickly that
BBEP was a partnership, and so I bailed immediately. Unfortunately,
I missed the nice 33% run up.
IRAs, etc., are taxed on UBTI (unrelated business taxable income) if
it exceeds $1,000 for the year. The $1,000 limit is not per
investment, but total UBTI for the year from all sources.
Partnership income is the typical source of UBTI for retirement
plans, but it can also come from debt-financed income (usually
margin accounts).
As long as no debt-financed income is involved, the partnership K-1
income is UBTI, and sometimes a portion of the gain from later
selling the partnership units is UBTI. If there is debt-financed
income, then even more of the gain from selling the units is UBTI.
It is possible to get whipsawed by these investments in that they
can generate a substantial K-1 income, but no change in market
value, or even worse, a loss in the value of the units. An IRA would
end up paying tax on phantom income, and getting no deduction for
the capital loss. "
Because of this new info, Doug and I will double our efforts to ID these things and NOT disseminate them in the future.
There is a great deal more I'd like to write about a government that
encourages PTPs, but I do not want to find myself in a secret prison
in Afghanistan or Eastern Europe, so I will restrain my fingers.
WW set new YTD highs every day this week thru Thursday, but lost
about 1/2% today (Friday), while every other index gained. Very
strange. WW is still outperforming the S&P 500 and the NASDAQ 100 by
substantial margins, YTD and QTD, but the Small and Micro Cap
indices are both outperforming us by slight margins this quarter,
thanks to our loss today.
Summary after Close on April 9, 2010
Nothing Sold this Week
Nothing Purchased this Week
S&P 500 GAINED 2.1% Quarter to Date
WEIMERandWIRTH GAINED 3.4% Quarter to Date
NASDAQ 100 (QQQQ) GAINED 1.8% Quarter to Date
S&P 500 GAINED 7.6% Year to Date
WEIMERandWIRTH GAINED 14.6% Year to Date
NASDAQ 100 (QQQQ) GAINED 7.2% Year to Date
S&P 500 GAINED 1.5% annually since June 30, 2001
WEIMERandWIRTH GAINED 26.1% annually since June 30, 2001
NASDAQ 100 (QQQQ) GAINED 0.9% annually since June 30, 2001
The returns above do NOT include the current quarter's dividends.
Dividends ARE included for the S&P 500's historical data, but NOT
for the NASDAQ 100's or for WEIMERandWIRTH's historical data.
Comprehensive return data and details are in the attached report.
Regards,
Henry
*************************************************************************************************
March 5, 2010 Report Cover Letter
Greetings,
The latest report is attached.
 Doug has been sharing the picks and I have been maintaining the
report since June 30, 2001. It was bound to happen sooner or later,
but last week we had our first known complaint. This complaint was
made by a Chartered Financial Analyst (CFA) who also holds a PhD in
statistics.
Doug has been sharing the picks and I have been maintaining the
report since June 30, 2001. It was bound to happen sooner or later,
but last week we had our first known complaint. This complaint was
made by a Chartered Financial Analyst (CFA) who also holds a PhD in
statistics.
Here's what he wrote:
1. "I am sorry to say, that your statistics prove absolutely
nothing."
2. "Your trades are often impossible to do because of thin markets."
3. "I don't know how your clients do, due to high volatility and wide
spreads."
4. "Nevertheless I find your info useful."
And here are my responses:
1. "I am sorry to say, that your statistics prove absolutely
nothing."
My response:
Doug and I disseminate financial information, NOT statistics.
Financial information almost never proves anything other than X was
greater than Y yesterday. That means there is no guarantee that X
will be greater than Y tomorrow. By now, any investor who is not
aware of that FACT is probably beyond learning anything.
The best you can hope for with financial information is that the
winning trend that has been identified, will continue to win in the
future. If valid financial statistics existed, do you really believe
the financial world would have come as close to collapse as it did?
2. "Your trades are often impossible to do because of thin markets."
My response:
Impossible? Absolutely not, because I use the average of the daily
HI-LO price. That means that trades have been executed at the prices
I use. And it means that many more trades have been executed at more
favorable prices than the prices I use.
However, I will admit that sometimes it will be frustratingly
difficult to execute at the average HI-LO of the day. All of this is
explained in excruciating detail on the "Portfolio Rules" page of
the attached report i.e., the report e-mailed to subscribers every
week.
If this were as easy as watching a football game or chowing down
junk food, then everyone would be rich, and that is clearly
impossible. I believe that successful trading requires discipline
and intestinal fortitude, and I also believe that you are either
going to get reasonably good at this game or you are probably going
to quit.
3. "I don't know how your clients do, due to high volatility and
wide spreads."
My response:
Every six months, Doug asks all subscribers for their performance
data. About 25% to 30% of you respond. I believe that anyone who has
been diligently attempting to execute the recommended trades has
come reasonably close to the returns that I report, and some of you
have been exceeding those reported returns.
At this point Doug and I have 53 paying subscribers i.e., we are
clearly not getting rich by maintaining our newsletter. That means
that WEIMERandWIRTH is a newsletter that Doug and I edit in order to
help keep our brain synapses firing, but there is very little reason
to misrepresent anything.
4. "Nevertheless I find your info useful."
My response:
Be still my heart!
Doug and I hope that all of you find our info useful.
The S&P 500 and the NASDAQ 100 (QQQQ) both finally made it into
positive territory this week. The good news is that WW is beating
both soundly. The bad news is that WW is barely beating its nemesis.
More on this next week unless something better comes up.
Summary after Close on March 5, 2010
3 SOLD on 3/5/2010
3 PURCHASED on 3/5/2010
S&P 500 GAINED 2.1% Quarter to Date
WEIMERandWIRTH GAINED 9.0% Quarter to Date
NASDAQ 100 (QQQQ) GAINED 1.5% Quarter to Date
S&P 500 GAINED 2.1% Year to Date
WEIMERandWIRTH GAINED 9.0% Year to Date
NASDAQ 100 (QQQQ) GAINED 1.5% Year to Date
S&P 500 GAINED 1.0% annually since June 30, 2001
WEIMERandWIRTH GAINED 25.7% annually since June 30, 2001
NASDAQ 100 (QQQQ) GAINED 0.3% annually since June 30, 2001
The returns above do NOT include the current quarter's dividends.
Dividends ARE included for the S&P 500's historical data, but NOT
for the NASDAQ 100's or for WEIMERandWIRTH's historical data.
Comprehensive return data and details are in the attached report.
Regards,
Henry
*************************************************************************************************
February 26, 2010 Report Cover Letter
Greetings,
The latest report is attached.
 Does WEIMERandWIRTH's frequent trading really add value?
Last week I answered that it depends on the market, but this week I
will attempt a comprehensive explanation.
During the bear market of 2008, WW's frequent trading added
virtually no value to a WW portfolio frozen at the end of 2007. The
actual WW Portfolio lost 41.4%; the frozen portfolio lost 42.6%.
During the bull market of 2009, WW's frequent trading more
than doubled the return of a frozen 2008 WW portfolio
(68.9% vs. 28.9%).
And, during the first eight see-sawing weeks of 2010, WW's frequent
trading added arguable value to a frozen 2009 WW portfolio, but the
year is still young. The actual WW Portfolio is worth about 2% to 3%
more than the frozen portfolio. Irrational exuberance is WW's best
friend, but there has been very little evidence of any exuberance
lately.
How can this information be used?
This information is extremely liberating. Years ago, when I was
still productively employed, my stock market junkie colleagues and I
would speculate that frequent trading during a bear market would add
value to a growth and momentum portfolio. I now know, beyond any
reasonable doubt, that this is simply not true. This information is
liberating because if you do not expect WW's frequent trading to add
value during a bear market, you will not be disappointed.
I also spent a great deal of time attempting to optimize the sale
date. I suspected it was also dependent on the market, but until I
finally got around to writing code to extract market dependent data,
I simply wasn't reasonably sure about it. I now also know, beyond
any reasonable doubt, that one is on a fool's errand if one attempts
to optimize the sale day without considering market conditions. That
is a huge breakthrough. This information frees you from worrying
about optimizing the sale date i.e., you can be confident that,
on average, the older picks will return more than
cash if (BIG IF) future returns are similar to the returns of the
past sixty years.
The bottom line is that during the past sixty years, the market had
positive returns about 75% of the time. If the future is similar to
the past (BIG IF again), that means that WW will probably
outperform about 75% of the time, sometimes by huge margins. During
the remaining 25% of the time, WW will probably do
no worse than an appropriate index.
We'll see…
This week ended almost where it started. It could be worse.
Summary after Close on February 26, 2010
5 SOLD on 2/26/2010
5 PURCHASED on 2/26/2010
S&P 500 LOST 1.0% Quarter to Date
WEIMERandWIRTH GAINED 2.5% Quarter to Date
NASDAQ 100 (QQQQ) LOST 2.2% Quarter to Date
S&P 500 LOST 1.0% Year to Date
WEIMERandWIRTH GAINED 2.5% Year to Date
NASDAQ 100 (QQQQ) LOST 2.2% Year to Date
S&P 500 GAINED 0.6% annually since June 30, 2001
WEIMERandWIRTH GAINED 24.9% annually since June 30, 2001
NASDAQ 100 (QQQQ) LOST 0.1% annually since June 30, 2001
The returns above do NOT include the current quarter's dividends.
Dividends ARE included for the S&P 500's historical data, but NOT
for the NASDAQ 100's or for WEIMERandWIRTH's historical data.
Comprehensive return data and details are in the attached report.
Regards,
Henry
*************************************************************************************************
December 11, 2009 Report Cover Letter
Greetings,
The latest report is attached.

Everyone knows there are huge differences between Japan and the US,
but there may also be many similarities: The Japanese economy
crashed in 1989 because of unsustainable stock market and real
estate bubbles. From the crash in 1989 thru Dec. 7, 2009 the large
cap NIKKEI 225 lost about 75% of its value. Real estate values also
remain in the doldrums.
Does a similar fate await US investors? We're gonna have to wait
another ten or so years before that question can be answered, but in
the meantime it may be worthwhile examining the returns of Japanese
Large Caps and Japanese Small Caps because the conventional wisdom
proclaims there are huge performance differences.
The Russell/Nomura Small Cap Index contains the bottom 15% of the
Russell/Nomura Total Market Index in terms of market capitalization,
but very little historical data are available. However, DFA has been
managing a small cap Japanese fund since August 1993. I will use the
return data of that fund as a proxy for the index because I know of
no other source that has longer term values for small cap Japanese
stocks.
Without further ado, here's a chart of the NIKKEI vs. the DFA
Japanese Small Cap Stock Fund (Ticker DFJSX). Both the small cap
fund and the NIKKEI 225 have been equilibrated to start at 100. All
values have been adjusted for dividends and distributions. I have
chosen to show ten years of performance data beginning with December
31, 1999 because that was about ten years after the Japanese bubbles
burst, and that's about where the US is right now, but remember:
Timing is everything.

The chart shows that Japanese Small Caps outperformed Japanese Large
Caps by substantial margins over the last ten years. Our future may
or may not resemble the chart above, but the data are interesting.
WW is unfortunately still trailing the big indices by uncomfortable
margins QTD. We are slightly behind the small cap index, but we
out-performing the micro cap index by a substantial amount.
Summary after Close on December 11, 2009
1 SOLD on 12/11/2009
1 PURCHASED on 12/11/2009
S&P 500 GAINED 4.7% Quarter to Date
WEIMERandWIRTH LOST 1.1% Quarter to Date
NASDAQ 100 (QQQQ) GAINED 4.4% Quarter to Date
S&P 500 GAINED 24.9% Year to Date
WEIMERandWIRTH GAINED 62.5% Year to Date
NASDAQ 100 (QQQQ) GAINED 48.4% Year to Date
S&P 500 GAINED 0.6% annually since June 30, 2001
WEIMERandWIRTH GAINED 24.7% annually since June 30, 2001
NASDAQ 100 (QQQQ) LOST 0.3% annually since June 30, 2001
The returns above do NOT include the current quarter's dividends.
Dividends ARE included for the S&P 500's historical data, but NOT
for the NASDAQ 100's or for WEIMERandWIRTH's historical data.
Comprehensive return data and details are in the attached report.
Regards,
Henry
*************************************************************************************************
October 30, 2009 Report Cover Letter
Greetings,
The latest report is attached.
 I
got the message below from
The October 17th Economist
I
got the message below from
The October 17th Economist
The Rationalizer should help you keep a cool head while you're
buying and selling:
ABN AMRO, a Dutch bank with intimate experience involving rash
decision making sponsored the development of emotion sensing systems
after research showed that traders who exhibit more intense
emotional reactions to monetary gain or loss also have significantly
worse trading results.
The Rationalizer, which is still under development, measures
emotional arousal and displays it as a moving light pattern. A cool
head will generate a mellow yellow display, but if it reaches a deep
red, it's time to take a break and cool down.
The losses during the last two weeks wiped out about two months of
gains for WW and the indices, but the good news is that October,
which is considered a dangerous month for traders and speculators,
is behind us. The other dangerous months are July, January,
September, April, November, May, March, June, December, August, and
February, but not necessarily in that order.
Summary after Close on October 30, 2009
8 SOLD on 10/30/2009
8 PURCHASED on 10/30/2009
S&P 500 LOST 2.0% Quarter to Date
WEIMERandWIRTH LOST 10.2% Quarter to Date
NASDAQ 100 (QQQQ) LOST 3.1% Quarter to Date
S&P 500 GAINED 16.9% Year to Date
WEIMERandWIRTH GAINED 47.6% Year to Date
NASDAQ 100 (QQQQ) GAINED 37.7% Year to Date
S&P 500 LOST 0.2% annually since June 30, 2001
WEIMERandWIRTH GAINED 23.6% annually since June 30, 2001
NASDAQ 100 (QQQQ) LOST 1.2% annually since June 30, 2001
The returns above do NOT include the current quarter's dividends.
Dividends ARE included for the S&P 500's historical data, but NOT
for the NASDAQ 100's or for WEIMERandWIRTH's historical data.
Comprehensive return data and details are in the attached report.
Regards,
Henry
*************************************************************************************************
May 1, 2009 Report Cover Letter
Greetings,
The latest report is attached.
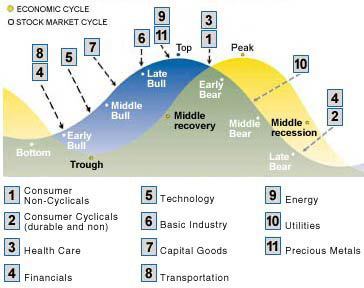
The chart above shows a typical business cycle and the points at
which various economic sectors tend to outperform the broader
market. Source: Standard and Poor's, based on a study analyzing the
differences in market returns of 90 Industries vs. the S&P 500
during 10 complete economic cycles from December 1945 - December
1995.
I do not believe this information can be used to optimize the return
of a WW portfolio, but I can tell you that the financial sector of
the WW portfolio is returning about four times as much as the rest
of the portfolio. The chart above is especially valuable because it
shows that the stock market cycle has historically preceded the
economic cycle. Note that the historical data show that if the
economy is in the middle of a recovery, then the stock market has
already peaked.
How many times have you heard this?
"I'm not gonna get in until I'm sure it's safe."
Good Luck!
It's too bad we don't know exactly where we are in the cycle, but
that will only be known when we have the wonderful benefit of
hindsight. Regardless, it was a very good week for WEIMERandWIRTH
Summary after Close on May 1, 2009
2 SOLD this week
3 PURCHASED this week
S&P 500 GAINED 10.0% Quarter to Date
WEIMERandWIRTH GAINED 19.7% Quarter to Date
NASDAQ 100 (QQQQ) GAINED 13.4% Quarter to Date
S&P 500 LOST 2.1% Year to Date
WEIMERandWIRTH GAINED 14.4% Year to Date
NASDAQ 100 (QQQQ) GAINED 15.6% Year to Date
S&P 500 LOST 2.5% annually since June 30, 2001
WEIMERandWIRTH GAINED 21.3% annually since June 30, 2001
NASDAQ 100 (QQQQ) LOST 3.5% annually since June 30, 2001
The returns above do NOT include the current quarter's dividends.
Dividends ARE included for the S&P 500's historical data, but NOT
for the NASDAQ 100's or for WEIMERandWIRTH's historical data.
Comprehensive return data and details are in the attached report.
Regards,
Henry
*************************************************************************************************
April 24, 2009 Report Cover Letter
Greetings,
The latest report is attached.
 The April 4TH-10TH issue of
The Economist had a 14-page Special Report on the "Rise and
Fall of the Wealthy". Last week I wrote about the reversal of real
estate prices over the past year.
The April 4TH-10TH issue of
The Economist had a 14-page Special Report on the "Rise and
Fall of the Wealthy". Last week I wrote about the reversal of real
estate prices over the past year.
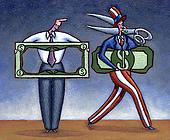
This week the topic will be: Who rates as rich and who handles the
fortunes of the rich?
Merrill Lynch's wealth-management report rates you as "rich" if you
have $1 Million in investable assets, but, according to
The Economist and
the May 2009 Atlantic
Monthly, many wealth managers will not bother with
anyone who has less than $10 Million.
Regardless, the real question is: What have highly compensated
wealth managers done for their clients during the global financial
crisis? The answer is: They have not earned their fees because,
proportionately, the rich lost about as much as the average investor
AND, there is no evidence
they earn more during the good times than the average investor.
Boston Consulting Group (BCG) reports that a great deal of private
banking benefits the bank more than the client. Often bankers will
be rewarded not just on the basis of assets under management, but on
product sales that seldom benefit the client.
The rich have become disillusioned with the people who look after
their fortunes. Surveys show that nobody believes anything advisors
are saying anymore, so 85% have made advisory changes. Law firms
report that half their wealthy clients do not use private wealth
management services at all, and the half that do are dissatisfied
with the advice they receive. The primary reason for opting to stay
with an advisor is not satisfaction with the advisor, but fear that
they would not be better served elsewhere.
Like everyone else, rich people want the impossible: high returns
with no risk. But their biggest fear, naturally enough, is losing a
chunk of their wealth so large that they would have to adjust their
lifestyle. Sound familiar? This fear created a 64% increase in
demand for gold bullion. Normally gold bullion is purchased through
the derivatives market, but many purchasers demanded physical
delivery during 2007 and 2008. For the next year or two, investors
will probably be much more cautious.
The bottom line is that the wealth management industry generally
promises a great deal more than it delivers, but the wealth
management industry will probably continue to thrive as long as
there are people who want the impossible: high returns with no risk.
So far, it has been a good quarter, but my perma-bear idol, Alan
Abelson is warning his followers to be prepared for more bad news
from the bourses. According to Alan, the only reason for this rally
is a total denial of all the bad economic news. The good news is
that all perma-bears are wrong more frequently than they're right,
but I agree that it's not a bad idea to be prepared.
Summary after Close on April 24, 2009
1 SOLD this week
1 PURCHASED this week
S&P 500 GAINED 8.6% Quarter to Date
WEIMERandWIRTH GAINED 13.9% Quarter to Date
NASDAQ 100 (QQQQ) GAINED 11.1% Quarter to Date
S&P 500 LOST 3.4% Year to Date
WEIMERandWIRTH GAINED 8.9% Year to Date
NASDAQ 100 (QQQQ) GAINED 13.3% Year to Date
S&P 500 LOST 2.6% annually since June 30, 2001
WEIMERandWIRTH GAINED 20.6% annually since June 30, 2001
NASDAQ 100 (QQQQ) LOST 3.7% annually since June 30, 2001
The returns above do NOT include the current quarter's dividends.
Dividends ARE included for the S&P 500's historical data, but NOT
for the NASDAQ 100's or for WEIMERandWIRTH's historical data.
Comprehensive return data and details are in the attached report.
Regards,
Henry
*************************************************************************************************
February 27, 2009 Report Cover Letter
Greetings,
The latest report is attached.
 This
week, on February 25, Jeremy J. Siegel, the esteemed Wharton
professor who wrote Stocks
for the Long Run, wrote an op-ed piece that was published in
The Wall Street Journal
titled The S&P Gets Its Earnings Wrong. He wrote that Standard and
Poor's (and most other index providers) calculate "aggregate"
earnings and P/E ratios for their indexes in a bizarre way that
makes stocks appear far more expensive than they really are i.e.,
"Stocks are cheaper than they look."
This
week, on February 25, Jeremy J. Siegel, the esteemed Wharton
professor who wrote Stocks
for the Long Run, wrote an op-ed piece that was published in
The Wall Street Journal
titled The S&P Gets Its Earnings Wrong. He wrote that Standard and
Poor's (and most other index providers) calculate "aggregate"
earnings and P/E ratios for their indexes in a bizarre way that
makes stocks appear far more expensive than they really are i.e.,
"Stocks are cheaper than they look."
S&P wrote, "Quite obviously, Professor Siegel's op-ed is flawed.
Rest assured that S&P firmly stands behind its earnings
calculations, and you can expect to see a published rebuttal
shortly."
The blogosphere has been having fun with this. It's gonna be
interesting to see whose reputation suffers most after the dust
settles.
In the meantime: Is the good professor right? Has Standard and
Poor's really been bizarrely miscalculating earnings since 1957? In
order to be able to answer that question, it is necessary to know
how S&P calculates its earnings, and it is necessary to know how the
good professor claims earnings should be calculated. This is gonna
take a little time, but I believe the explanation is worth whatever
time and effort it takes.
The S&P 500 is a capitalization weighted index, meaning stocks that
have larger caps have a greater impact on the value of the index.
However, earnings and losses are simply added together, without
regarding the size of the company.
For example, let's create a new index called the BS index
The index will only have two component companies: B and S
B is a BIG company, and S is a small company (Gotcha, didn't I?)
If company B earned ten million dollars and company S lost ten
million dollars, how much did the BS index earn?
According to S&P's methodology, the index earned nothing because the
gain of B was cancelled by the loss of S
According to Jeremy J. Siegel, the reported earnings should be
dependent on the size of the company i.e., a larger company's
earnings should have more of an impact than a smaller company's
earnings. Since the losers are likely to be small companies, their
losses should have very little impact on the earnings of the index.
At first blush, this appears to be bizarrely illogical: 10 minus 10
equals 0
10 minus 10 does NOT equal 10, or 9, or anything else but 0
But could it?
Yes it could!
Huh?
Remember, when you buy stocks, it is FUTURE earnings that are
important.
In a capitalistic system, small companies that lose money will
either earn money in the future or they will disappear, unless they
are given taxpayer money by politicians who are more worried about
disappearing themselves. Large companies that make money will
probably (arguably) get larger and make more money.
So, in the future, the aggregate earnings of B and S are highly
likely to be 11 minus 0 because S will either have disappeared, or
(better) it will have reinvented itself as a company that doesn't
lose money.
I have just given you a compelling reason to completely disregard
all losses. Don't you feel much better
about the Global Financial Crisis? I am now prepared to teach a
seminar on Creative Finance so that one can learn how to use
knowledge and imagination to make 1 + 1 = 1,000
Summary after Close on February 27, 2009
4 SOLD this week
5 PURCHASED this week
WEIMERandWIRTH Lost 14.3% Quarter to Date
NASDAQ 100 (QQQQ) Lost 7.4% Quarter to Date
S&P 500 Lost 18.6% Quarter to Date
Comprehensive return data are shown in the attached report
Regards,
Henry
*************************************************************************************************
December 31, 2008 Report Cover Letter
The latest report is attached.
Global stock markets are currently about $30 Trillion below their
peak. Here's a summary of major market losses, including dividends,
during 2008:
US large caps lost 37.0%
US Small Caps lost 36.1%
US Micro Caps lost 33.8% (excl dividends)
Developed Europe lost 44.7%
The Developed Pacific lost 34.4%
Emerging Markets lost 52.8%
Last year the S&P 500, including dividends, lost 37.0%; it was the
worst year in the history of the S&P 500. The second worst year was
1974, during which the index, including dividends, lost 24.3%. The
good news is that the S&P 500, including dividends, gained 34.7% in
the following year. Let us all hope there is a corresponding gain
during 2009, but be emotionally and financially prepared for more
bad news and further declines.
You may be interested in Warren Buffett's opinion:
(Is the Oracle of Omaha a "Buy & Hold" investor OR is he
really a Market Timer?)
New York Times,
October 17, 2008
 The financial world is a mess, both in
the United States and abroad. Its problems, moreover, have been
leaking into the general economy, and the leaks are now turning into
a gusher. In the near term, unemployment will rise, business
activity will falter and headlines will continue to be scary.
The financial world is a mess, both in
the United States and abroad. Its problems, moreover, have been
leaking into the general economy, and the leaks are now turning into
a gusher. In the near term, unemployment will rise, business
activity will falter and headlines will continue to be scary.
So ... I’ve been buying American stocks. This is my personal account
I’m talking about, in which I previously owned nothing but United
States government bonds. (This description leaves aside my Berkshire
Hathaway holdings, which are all committed to philanthropy.) If
prices keep looking attractive, my non-Berkshire net worth will soon
be 100 percent in United States equities. (This sounds a lot like
Market Timing to Henry Wirth. Regardless of what it's called, it is
definitely NOT "Buy and Hold Forever".)
Why?
A simple rule dictates my buying: Be fearful when others are
greedy, and be greedy when others are fearful. And most
certainly, fear is now widespread, gripping even seasoned investors.
To be sure, investors are right to be wary of highly leveraged
entities or businesses in weak competitive positions. But fears
regarding the long-term prosperity of the nation’s many sound
companies make no sense. These businesses will indeed suffer
earnings hiccups, as they always have. But most major companies will
be setting new profit records 5, 10 and 20 years from now.
Let me be clear on one point: I can’t predict the short-term
movements of the stock market. I haven’t the faintest idea as to
whether stocks will be higher or lower a month — or a year — from
now. What is likely, however, is that the market will move higher,
perhaps substantially so, well before either sentiment or the
economy turns up. So if you wait for the robins, spring will be
over.
A little history here: During the Depression, the Dow hit its low,
41, on July 8, 1932. Economic conditions, though, kept deteriorating
until Franklin D. Roosevelt took office in March 1933. By that time,
the market had already advanced 30 percent. Or think back to the
early days of World War II, when things were going badly for the
United States in Europe and the Pacific. The market hit bottom in
April 1942, well before Allied fortunes turned. Again, in the early
1980s, the time to buy stocks was when inflation raged and the
economy was in the tank. In short, bad news is an investor’s
best friend. It lets you buy a slice of America’s future at
a marked-down price.
Over the long term, the stock market news will be good. In the 20th
century, the United States endured two world wars and other
traumatic and expensive military conflicts; the Depression; a dozen
or so recessions and financial panics; oil shocks; a flu epidemic;
and the resignation of a disgraced president. Yet the Dow rose from
66 to 11,497. You might think it would have been impossible for an
investor to lose money during a century marked by such an
extraordinary gain. But some investors did. The hapless ones bought
stocks only when they felt comfort in doing so and then proceeded to
sell when the headlines made them queasy.
Today people who hold cash equivalents feel comfortable. They
shouldn’t. They have opted for a terrible long-term asset, one that
pays virtually nothing and is certain to depreciate in value.
Indeed, the policies that government will follow in its efforts to
alleviate the current crisis will probably prove inflationary and
therefore accelerate declines in the real value of cash accounts.
Equities will almost certainly outperform cash over the next decade,
probably by a substantial degree. Those investors who cling now to
cash are betting they can efficiently time their move away from it
later. In waiting for the comfort of good news, they are ignoring
Wayne Gretzky’s advice: “I skate to where the puck is going to be,
not to where it has been.”
I don’t like to opine on the stock market, and again I emphasize
that I have no idea what the market will do in the short term.
Nevertheless, I’ll follow the lead of a restaurant that opened in an
empty bank building and then advertised: “Put your mouth where your
money was.” Today my money and my mouth both say equities.
Warren Buffett is the chief executive of Berkshire Hathaway, a
diversified holding company.
The legendary Warren Buffet appears to be recommending a US stock
allocation of 100%. My stock valuation model shows that the S&P 500
is more undervalued now than it has ever been relative to US
government bonds, but 100% is a bit too much for me: I'm
recommending 75% for stocks, which is as high as I would ever go.
Perhaps that explains why I'm not legendary. Regardless, for a more
comprehensive explanation, see the asset allocation page on
HenryWirth.com and follow the links.
I wish I could tell you that WEIMERandWIRTH lost less than the
indices, but obviously, we did not. However, if WW can continue to
outperform on the way up, then the rewards will be well worth the
effort.
WEIMERandWIRTH December 31, 2008 Report Summary
0 SOLD this week
0 PURCHASED this week
WEIMERandWIRTH Lost 24.3% Quarter to Date
NASDAQ 100 (QQQQ) Lost 23.6% Quarter to Date
WEIMERandWIRTH Lost 41.4% Year to Date
NASDAQ 100 (QQQQ) Lost 41.9% Year to Date
Regards,
Henry
*************************************************************************************************